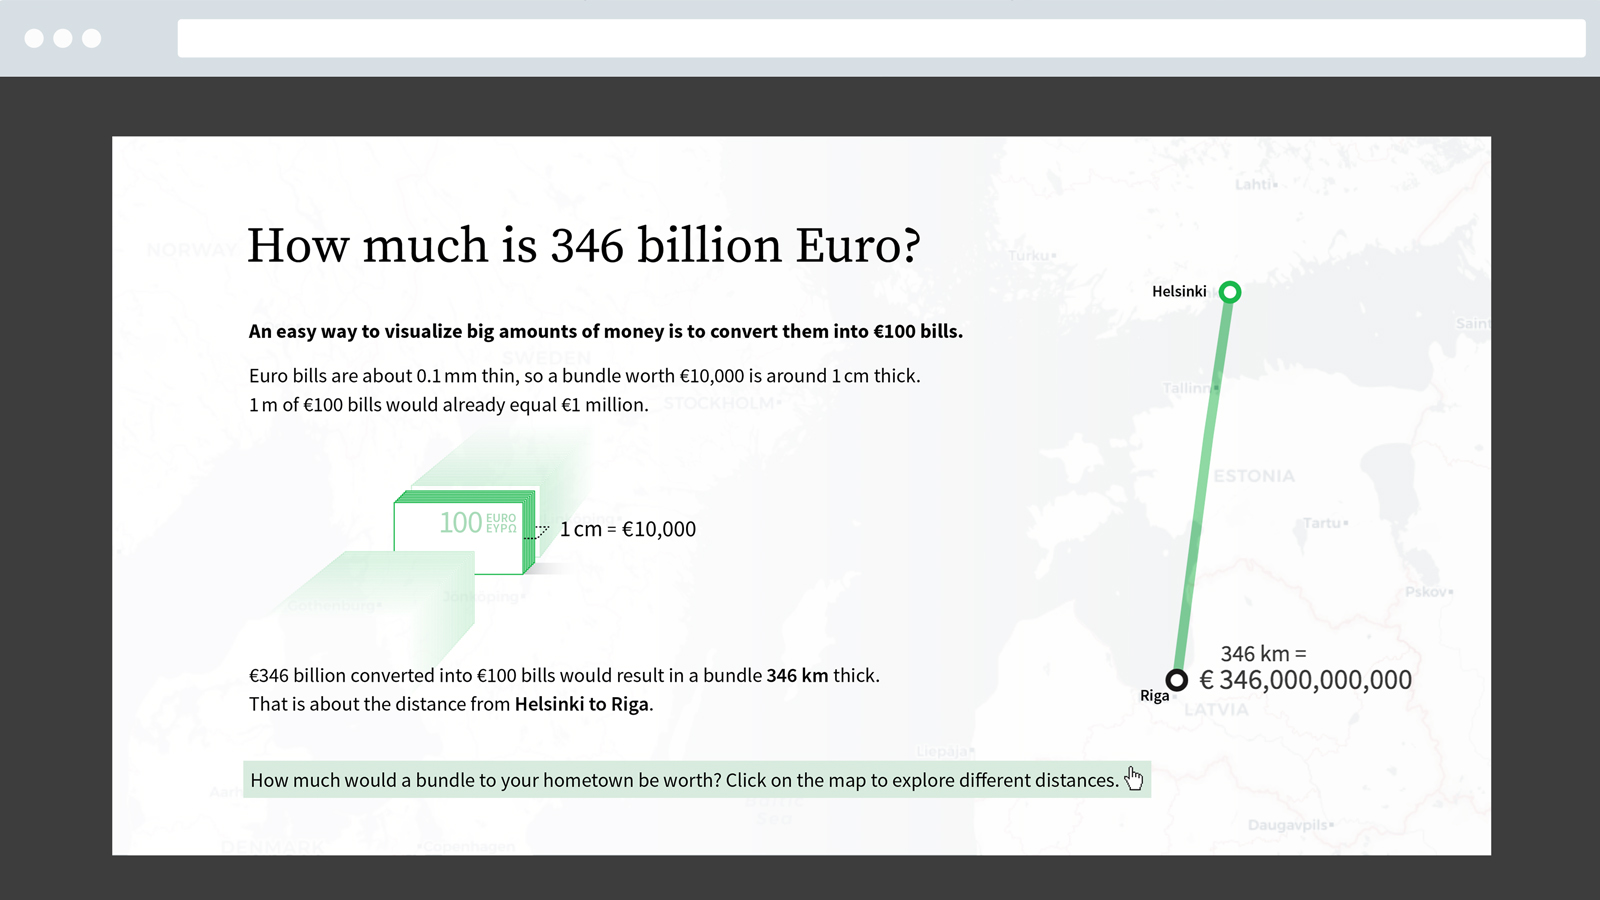
Extreme numerical magnitudes in all forms are part of our daily lives. Unfortunately, measures outside our immediate experience are notoriously difficult to imagine, and therefore carry little meaning to the average person. This can lead to misinterpretations, misjudgments, or in the worst case, complete disregard of important issues.
The aim of this thesis was to investigate how large numerical measures can be explained in ways that are relatable and support meaningful decisions in viewers/users.
On a practical level this included analyzing existing visualizations, describing a framework for presenting extreme magnitudes, and creating three interactive visualization prototypes which were used to conduct an insight-based evaluation / user test.

