FinnGen in Numbers 2026
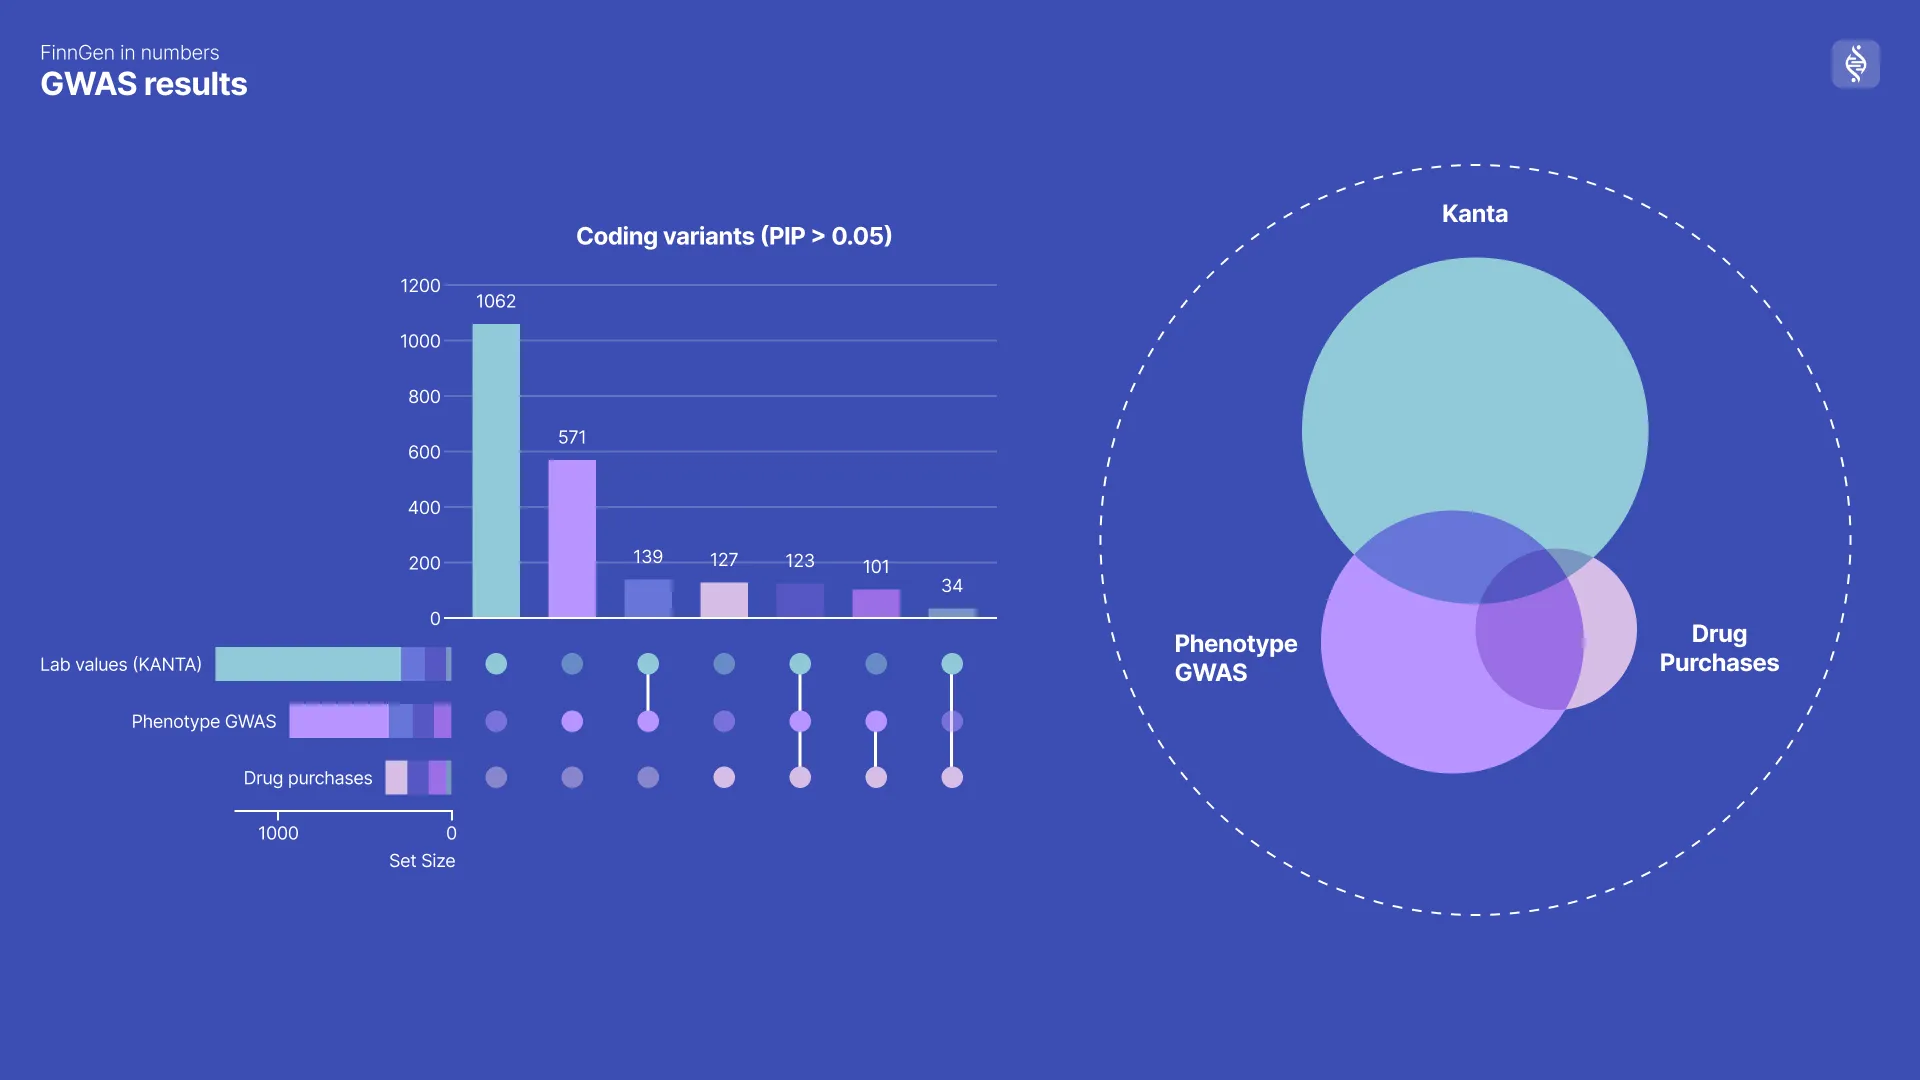
FinnGen in Numbers is a series of animated infographics created for FinnGen’s Face2Face annual conference. The project aims to present complex genetic and health data in an accessible and engaging way, allowing attendees to grasp key insights quickly. The animations highlight trends, correlations, and significant findings from the FinnGen study, making the information more digestible for a diverse audience. For this second year improved the visualizations in terms of motion and clarity. A great deal of effort was put into the new Tools section, to showcase all the different outputs that the FinnGen project produces, especially the ones made by us at Aalto.