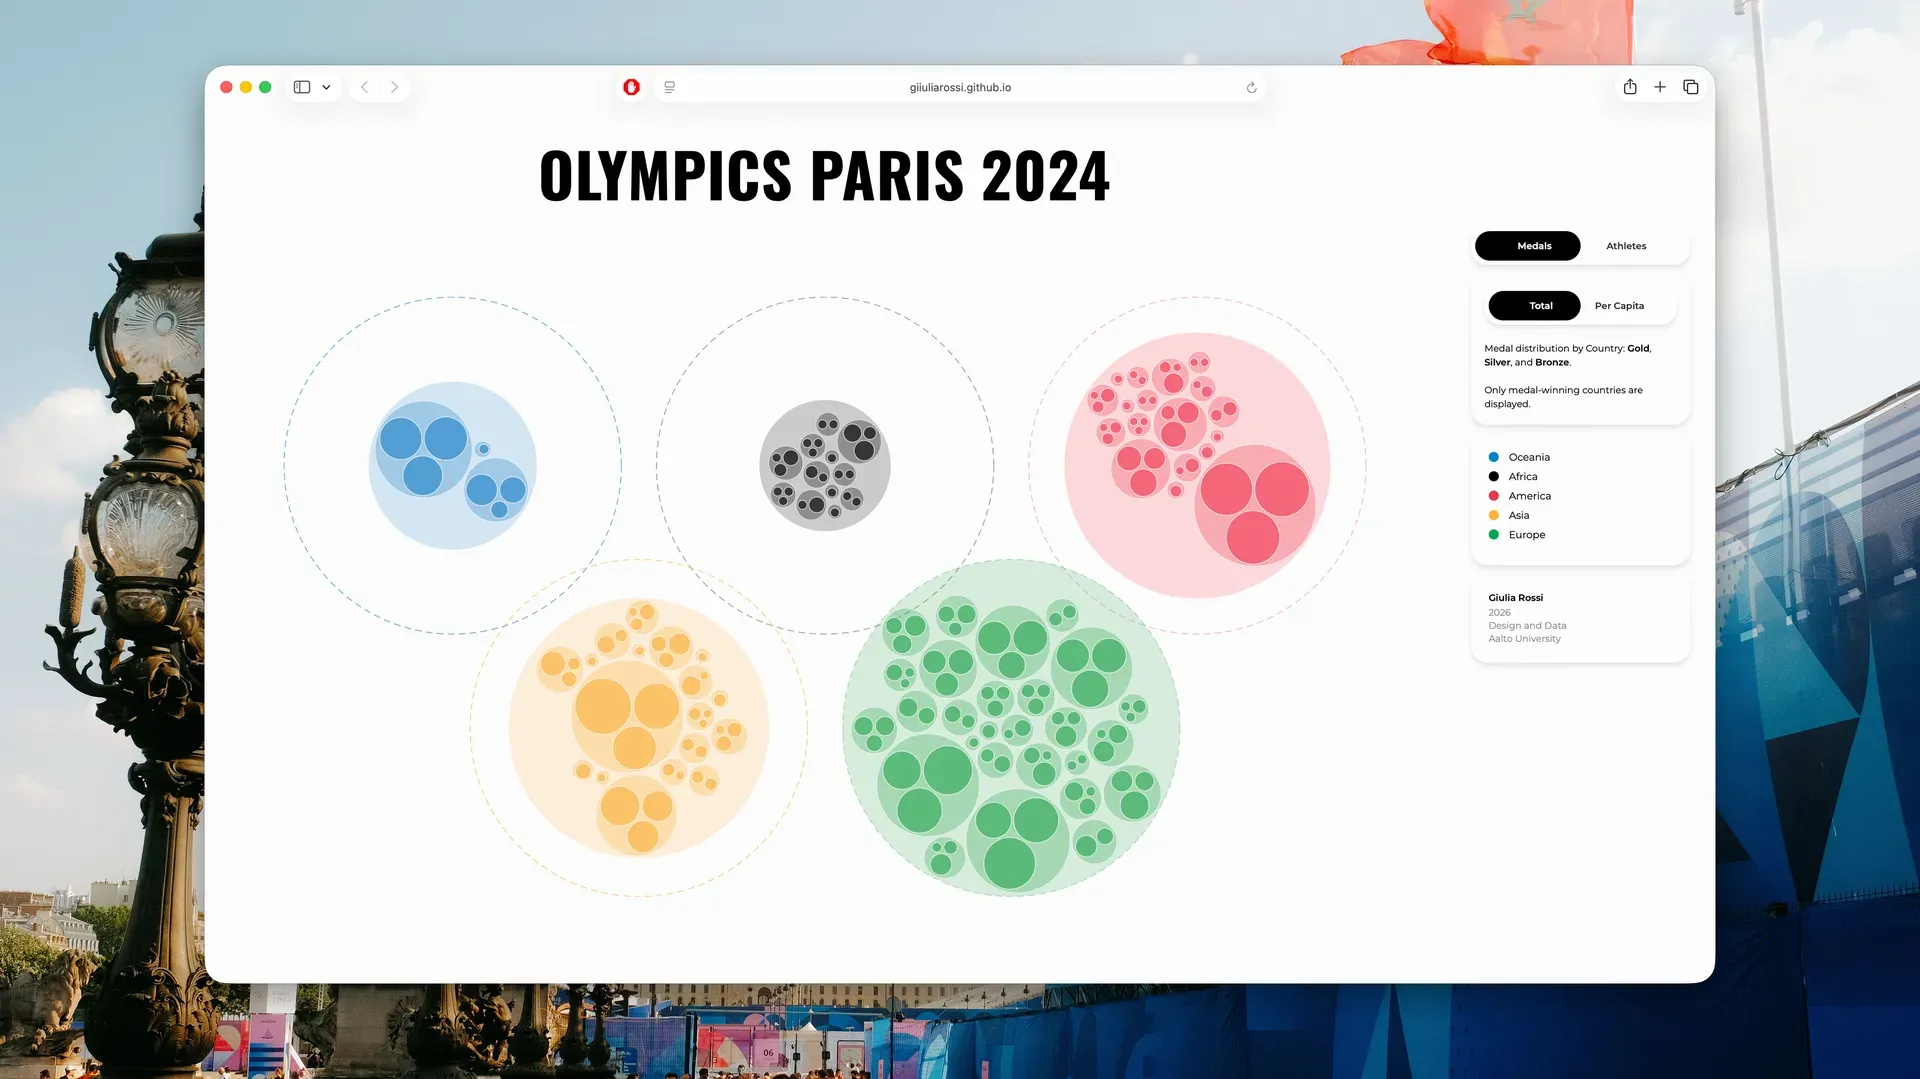
Olympics Paris 2024
The Olympic Games bring together athletes from around the world, generating a vast amount of data about competitions, participants and results. This project uses data visualisation to explore the Paris 2024 Olympic Games, looking beyond the event’s most familiar rankings to examine how sporting achievements and participation can be understood from different points of view.
Developed using D3.js, the project started with the collection and organisation of multiple datasets covering athletes, teams, events, results, medals and other aspects of the Games. From this broad range of information, a selection of variables was made to explore the Olympics, from individual athletes to nations, continents and the global picture.
The visualisations examine medal distribution across countries and continents, both in terms of total medals and in relation to population size (this comparison challenges the traditional medal table, highlighting how smaller nations can achieve remarkable results relative to their population), the age of athletes and participation across different sports, offering different ways to compare and interpret the data behind the Games.
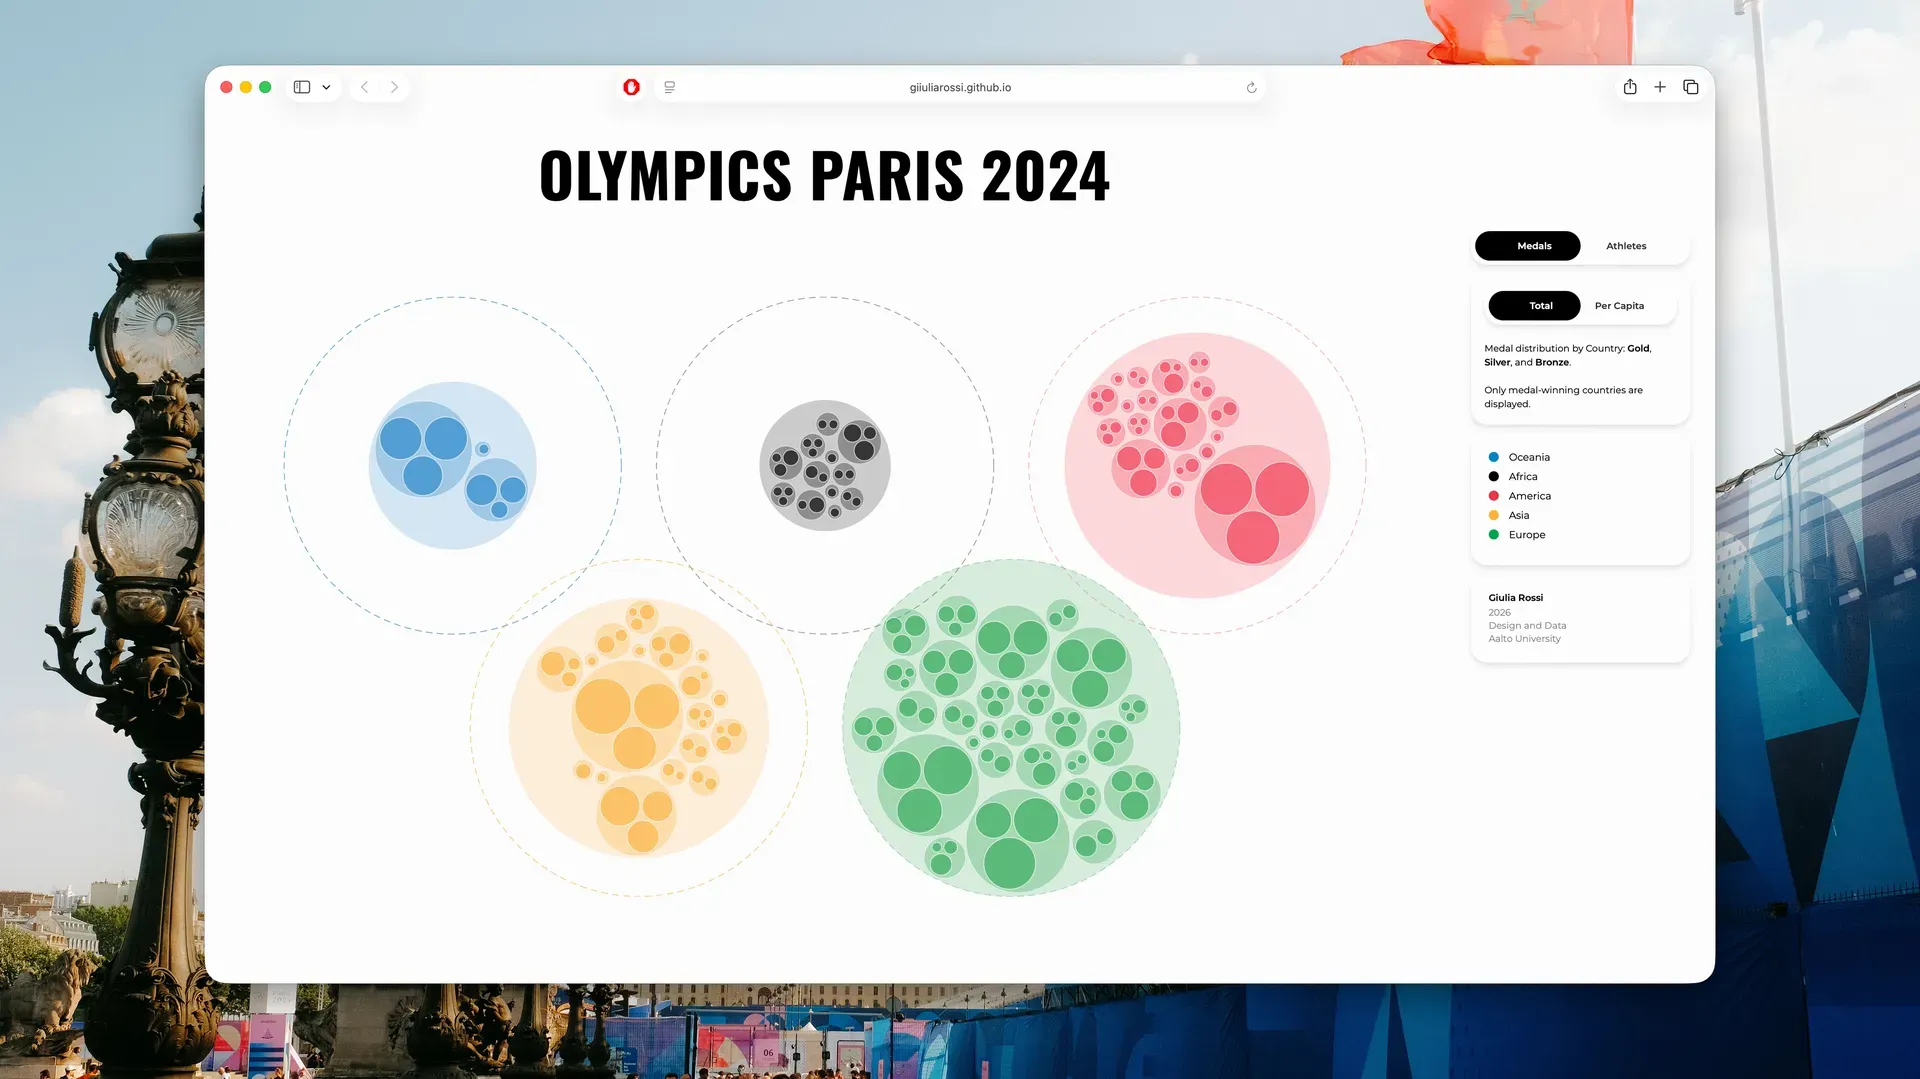 Total number of medals won by country and continent
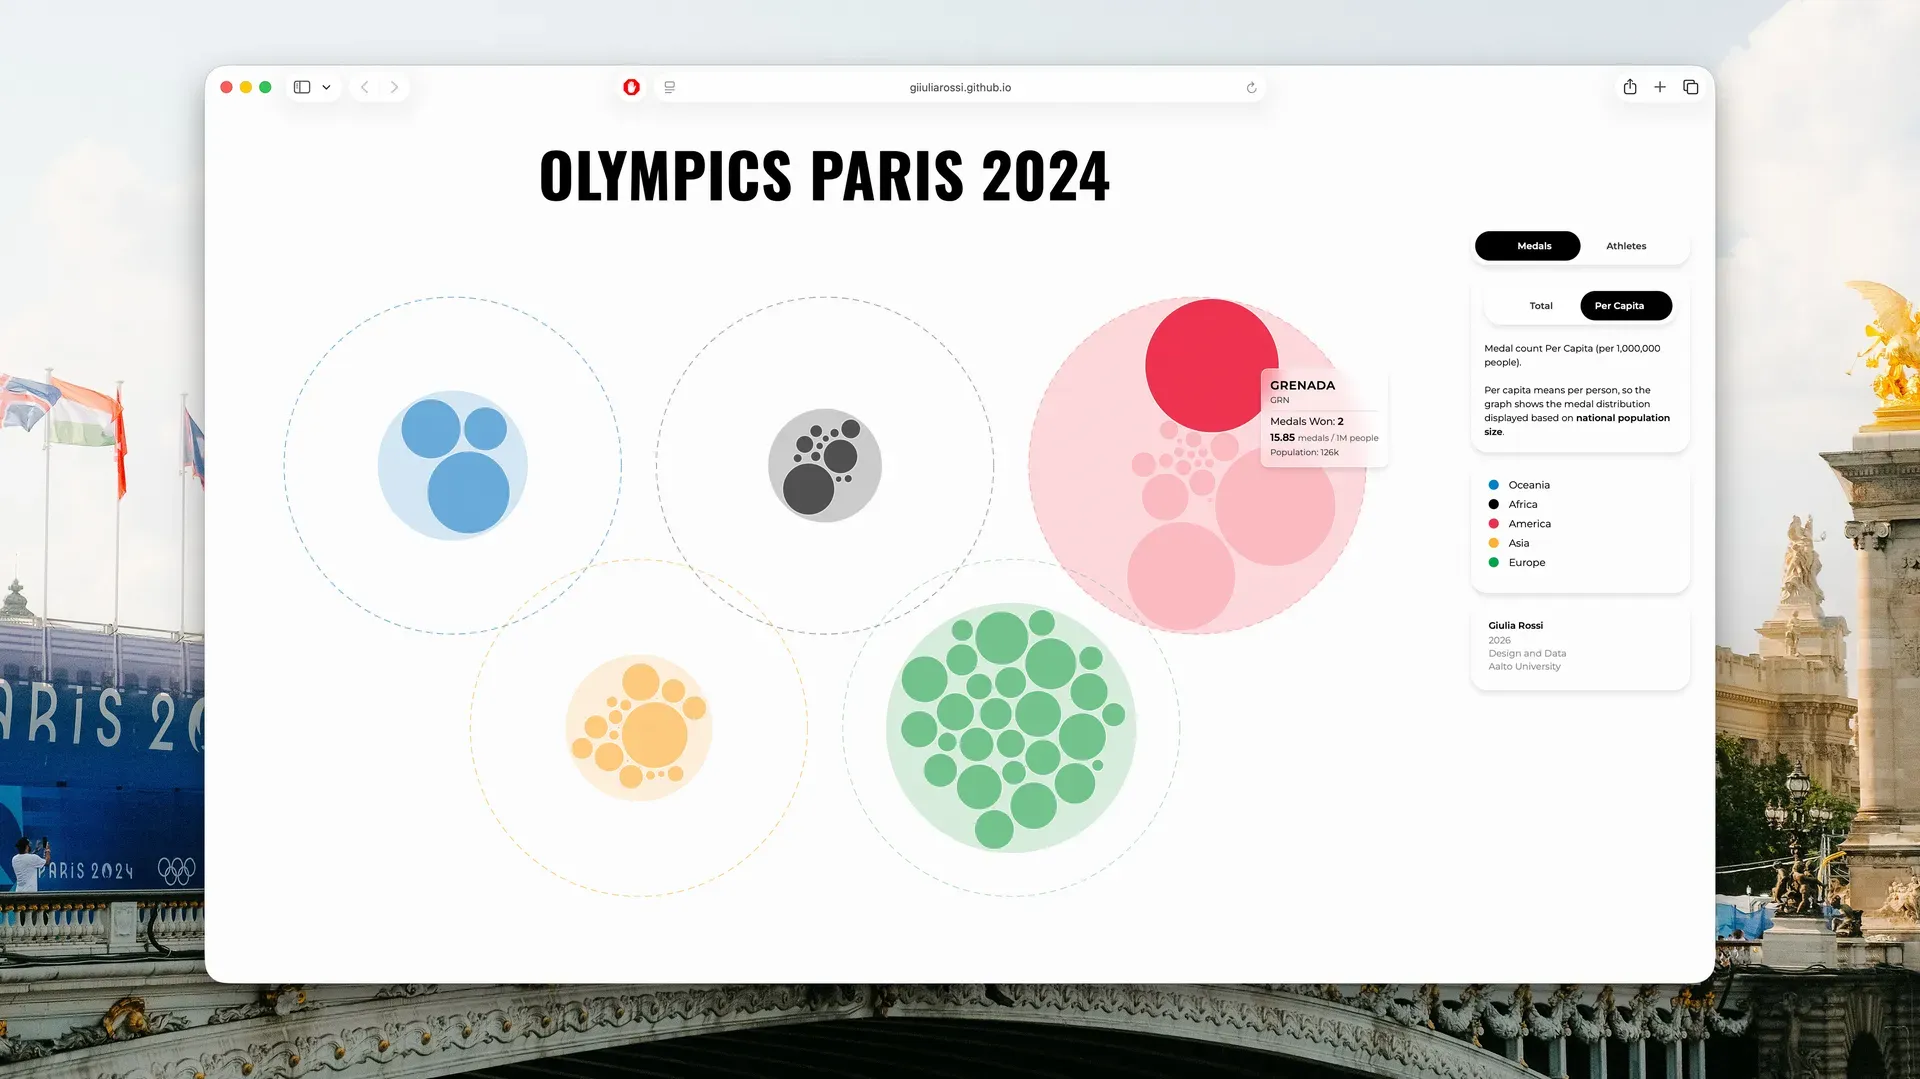 Medals won per capita by country and continent
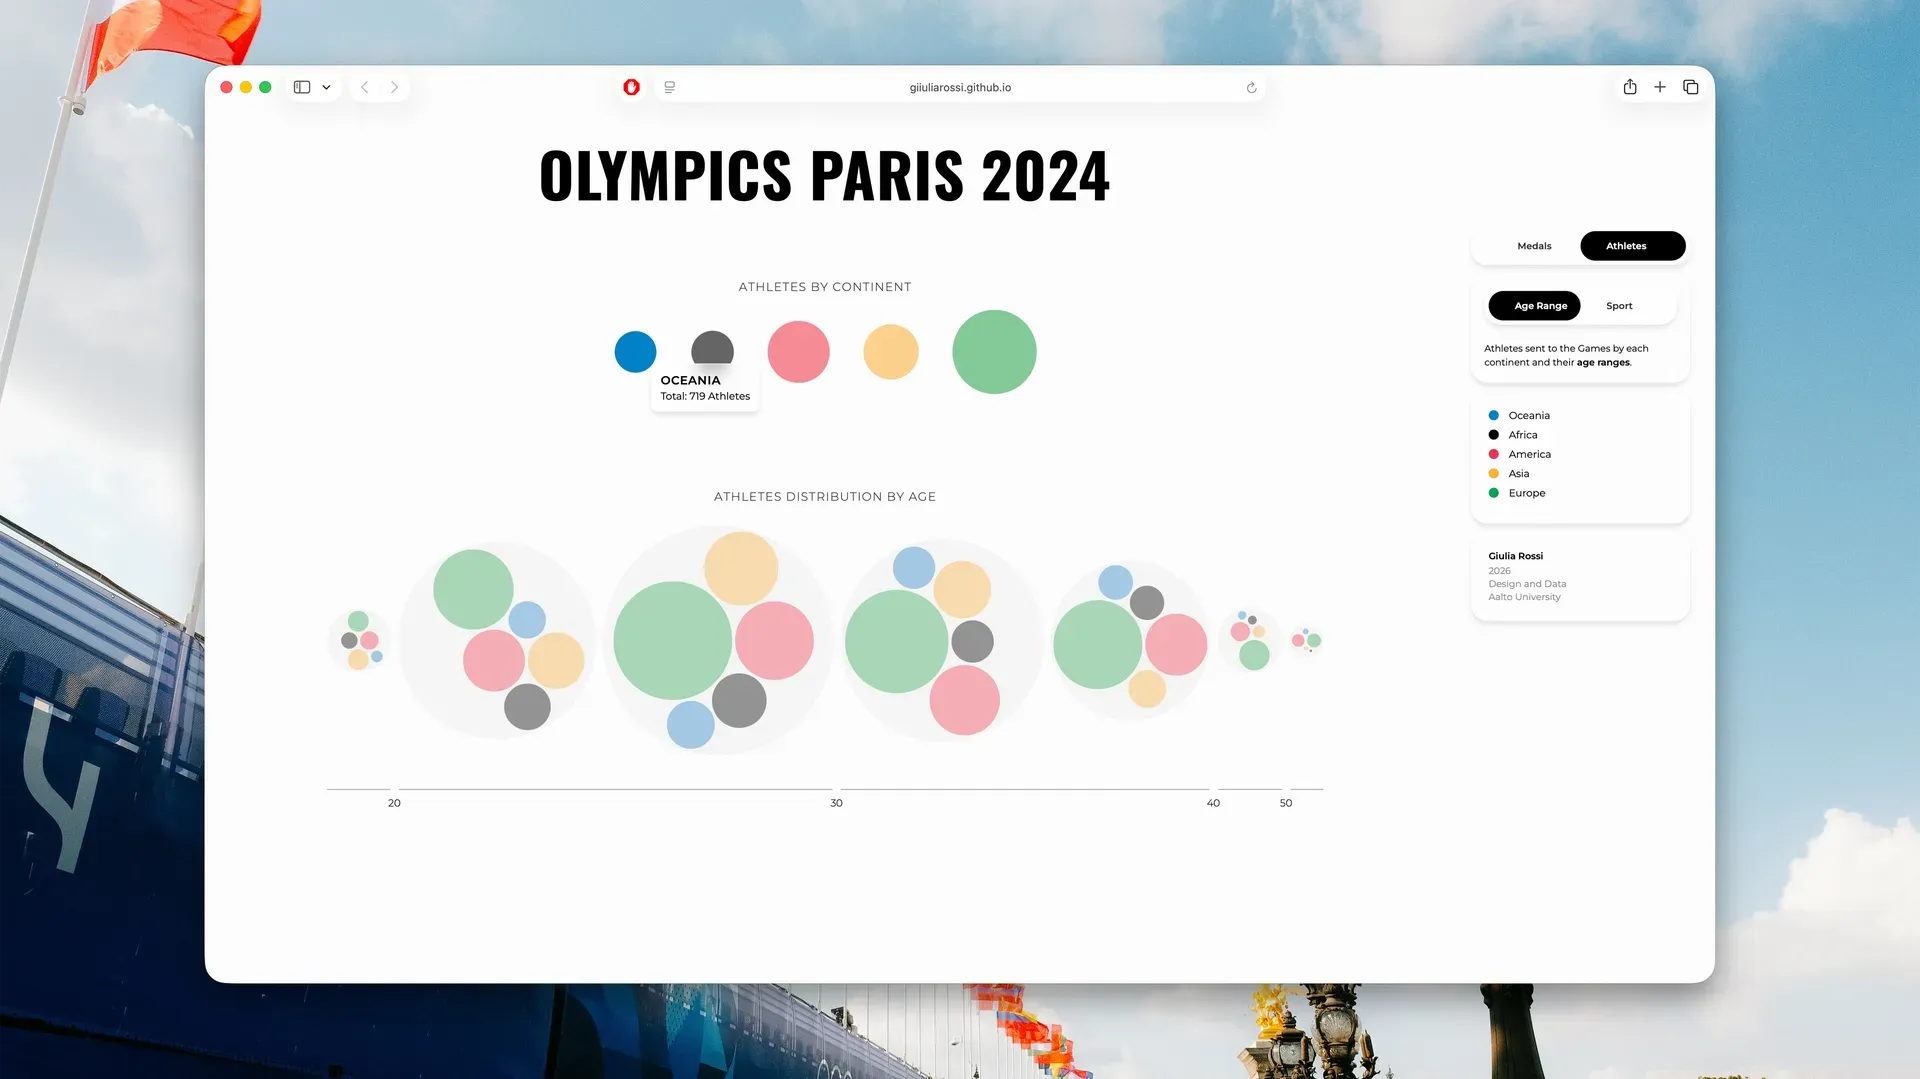 Age of the athletes
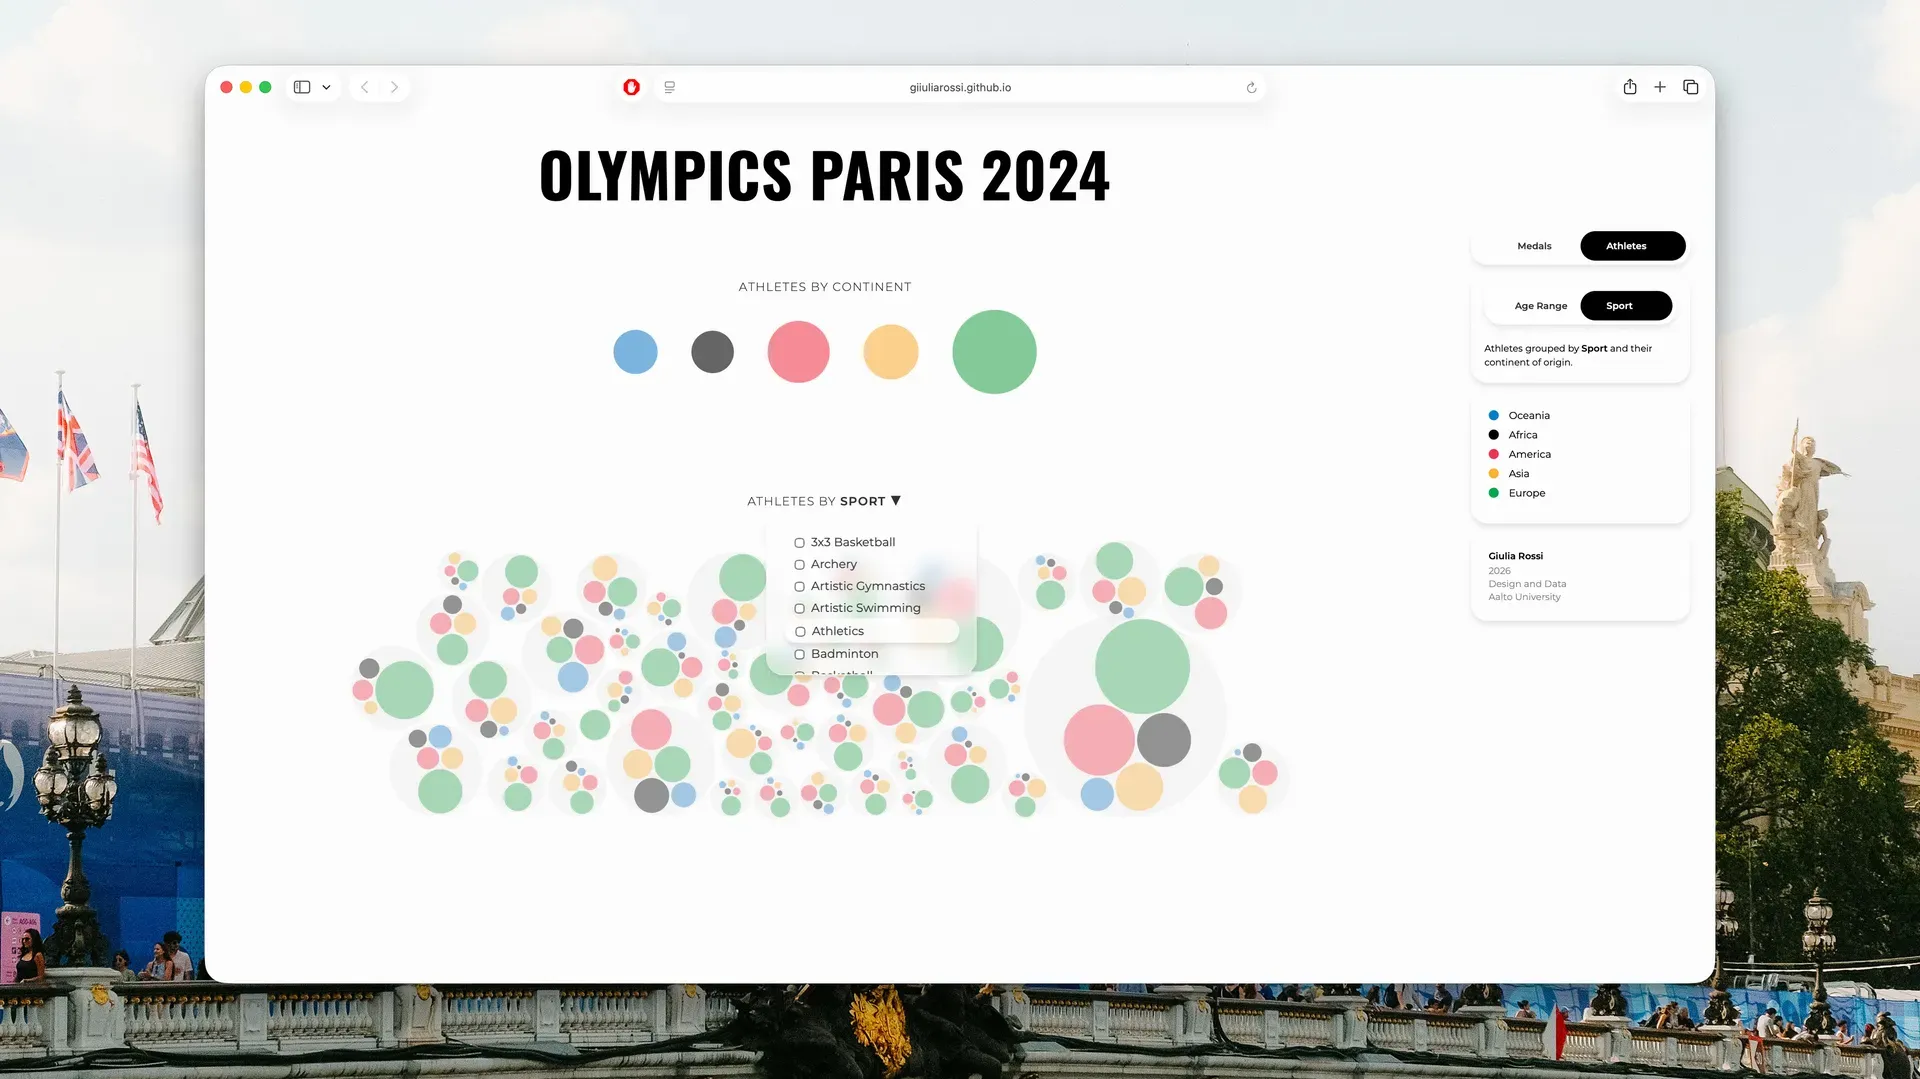 Participation across different sports
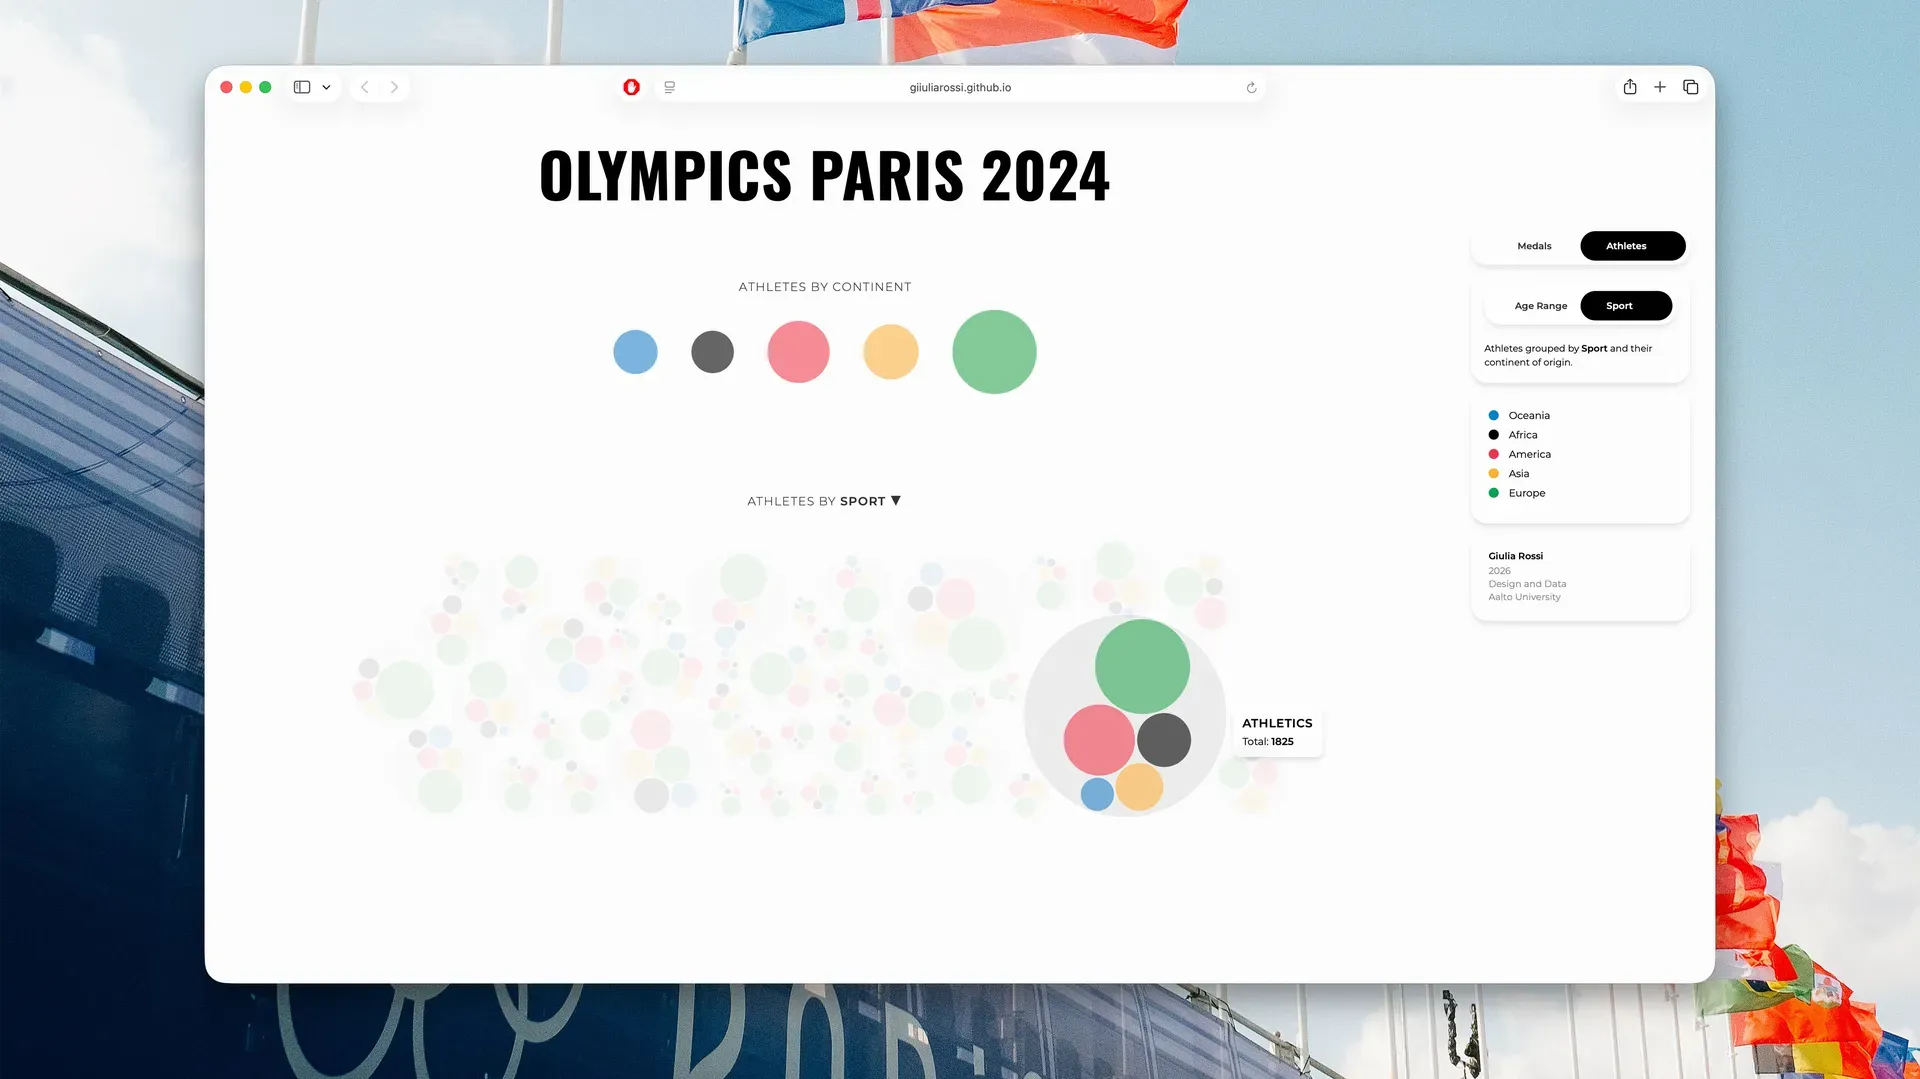 Participation across different sports