The endpoint browser is a work-in-progress, stand-alone visual browsing application for FinnGen-specific phenotypic data. Phenotypic data in this case refers to indicators of health events or outcomes defined using different data from health registries. These indicators in FinnGen are referred to as endpoints, and they are generally accessed through a phenotype-level data exploration system Risteys. This browser application is designed to ultimately be implemented as a component in Risteys, merging the browser to the front-page of the parent system.
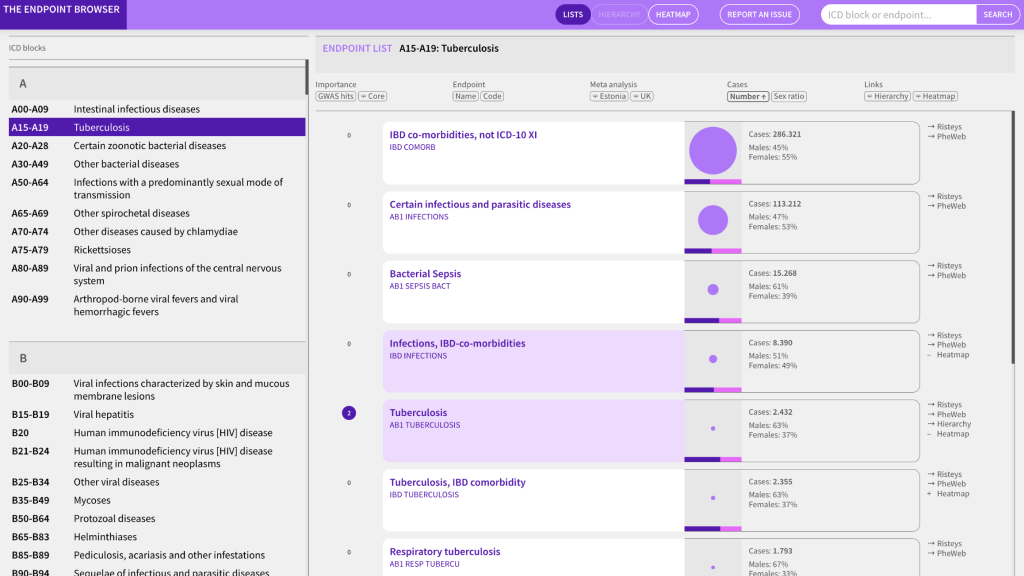
Risteys is a public online platform where researchers acquire information about different endpoints including facts and figures about their definitions, statistics and their relationships with other endpoints. This visualization project included asking what kind of challenges users are experiencing while exploring phenotypic data in Risteys, and how these challenges can be addressed by data visualization.
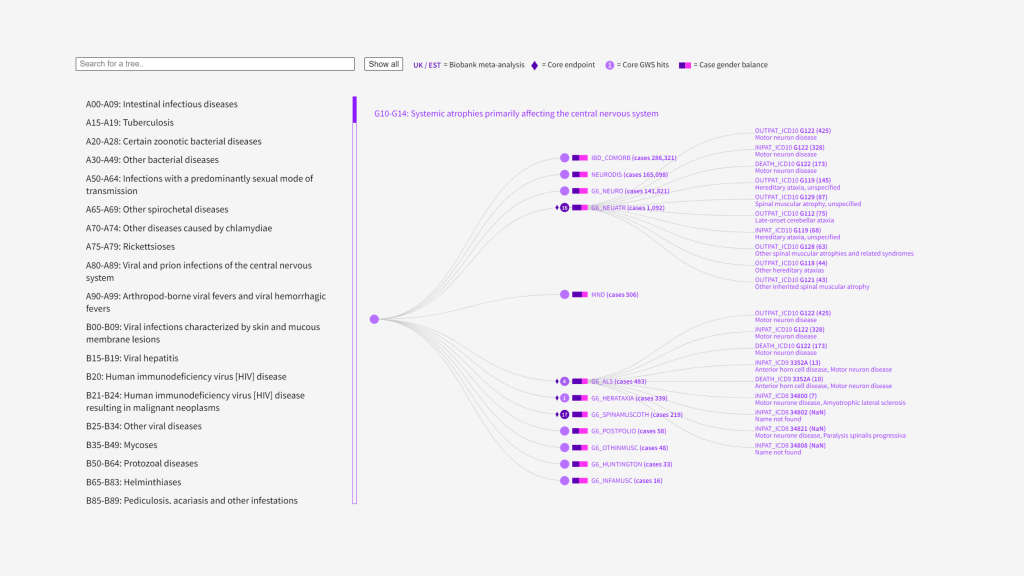
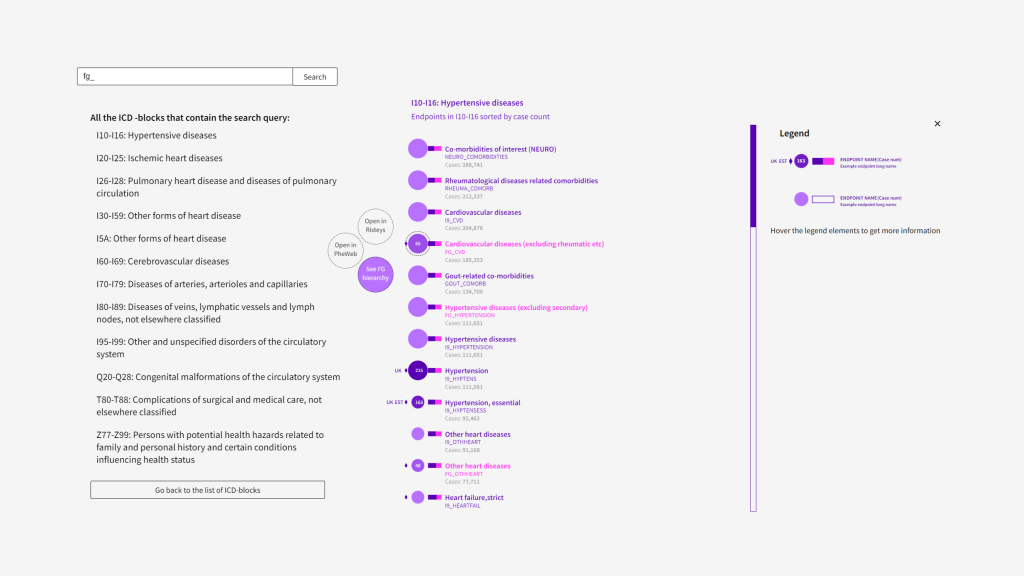
This visualization widens the context of presentation for each endpoint from Risteys by positioning them in the ICD-10 hierarchy, and thus providing an overview of the neighbourhoods of each endpoint. On top of this, each endpoint has the potential to be visible in a FinnGen-specific hierarchy as well, and these can also be observed. First -level comparisons between endpoints are enabled through visual encoding methods coding primary information for the users; These include statistical numbers such as case numbers, genome-wide significance hits numbers, gender case balance and information on meta-analyses conducted for each endpoint.