Background
Variant calling is the process of identifying variants from sequence data. This is done through a biological assay system, called Affymetrix chip, which assigns the genotypes (AA, Aa, aa) to genetic data. However, genotypes of rare variants are often poorly identified by automated softwares due to the limited amount of data available. The goal of this project was to improve the calling of rare variants – specifically those that are too rare to be inputted – as these rare variants can be especially important for understanding the genetic causes of diseases.

Challenge
To assess how accurate genotype calls are for a variant, calls can be represented as a cluster plot, with the X axis representing major allele intensity, and the Y axis representing minor allele intensity. Each dot corresponds to one individual in the data set. If the calls are of high quality, they form clear clusters which represent genotype calls (AA, Aa, aa). However, cluster plots of rare variants often show no clear separation between clusters and they have many missing calls (i.e. no genotype has been assigned). Due to the difficulty of calling rare variants, the data from these variants usually can not be used.
Notes
Raw calls – Genotype calls generated directly from the Affymetrix chip’s calling software.
Imputed calls – The expected values of variants that have not been genotyped directly on the chip.
Visualization
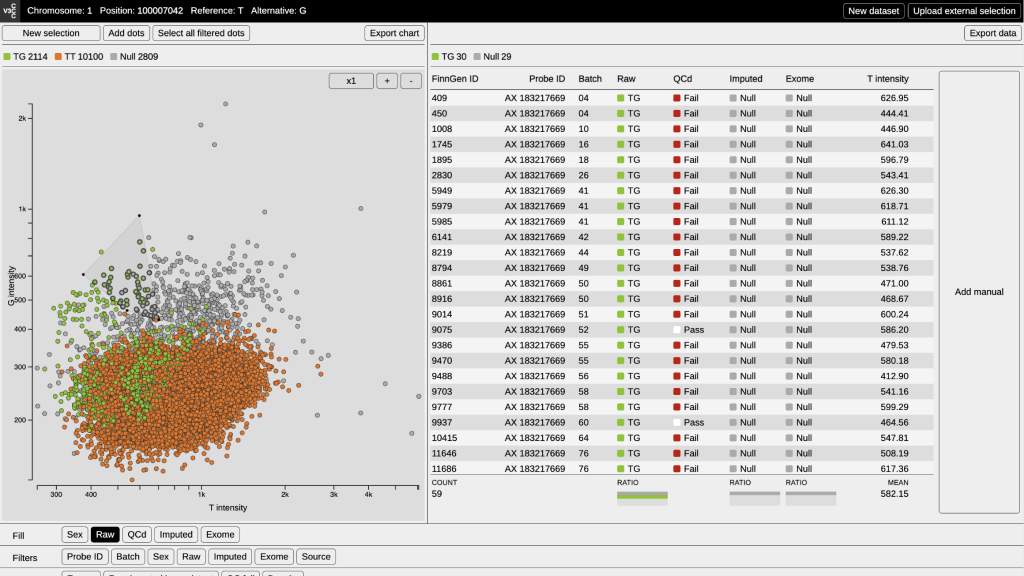
The Variant Cluster Call Corrector is a tool that helps researchers explore the data created by automatic variant calling (the “raw calls”), and enables them to manually imput the call of rare variants.
The interface consists of four main areas:
- Heading – The upper area declares the content of the dataset, listing the chromosome, genetic position and the possible genotypes.
- Visualization – On the left, the dataset is visualized on a cartesian space.
- Table – On the right, the information of the selected data points in the visualization is displayed in a spreadsheet.
- Tools – The bottom space is dedicated to a panel for coloring and filtering the data points of the visualization and for showing density isolines.
Features
- Plot – Every datum is plotted in a cartesian space according to its alleles intensities. If the dataset has a good quality calling, three different clusters (AA, Aa, aa) will be plotted. Otherwise, the clusters will mix into each other. The tool works only with tsv files.
- Color – Data points can be colored according to raw calls, imputed calls, manual calls and sex. The counting of dots for each category will update according to coloring.
- Filter – Data points can be filtered according to genotype calls, sex or batch. Interesting batch effects occur when the filtering output is a compact cluster with specific colouring. The user can eventually combine the filters in order to improve the selection process
- Density – The density of the data points can be shown as overlayed isolines. This functionality is useful when batches overlap on each other and hide data.
- Selection – Data points can be selected through polygonal selection or by adding adding single points after clicking on them. Both the single-point and the polygonal selection allows inspection of the dataset: ID, batch number, sex and callings are displayed on a table. On the bottom of the table, small bar charts display the ratio between the categories of each parameter: this is be useful to detect unwanted data points in the selection.
- Manual call – The tool gives the possibility to add a new parameter to the dataset: the manual call. Creating this new column, wrongly called data points can be corrected. In order to operate this funcionality it is necessary to have an active selection.
- Export – The user can export both the whole dataset with the new manual-call column and the selected data. Furthermore, the active filtered chart can be exported into a jpg or svg file.